
How It Works
Our engine processes your inputs using verified datasets and logic models to provide real-time results.
Efficiency Tips
Ensure data accuracy for the most reliable interpretation.
Compare results across different scenarios to find the optimal path.
Did you know?
Using standardized tools reduces manual error by up to 95% in complex calculations.
Related Expert Tools
More precision tools in the same niche.
Bone Fragmentation Index Calculator
The Bone Fragmentation Index Calculator works out the NISP:MNE ratio per taxon and skeletal element, or a weighted average bone completeness percentage from recorded portion brackets. It includes a built-in caution about the equifinality problem, since carnivore gnawing, trampling, and sediment attrition can all produce a high fragmentation ratio that looks statistically similar to intensive human butchery.
MNI Calculator
The MNI Calculator works out the Minimum Number of Individuals in a skeletal assemblage by comparing left and right element counts and taking the highest one. It also checks MNI against NISP, explains how MNI ties back to MNE and MAU, and includes a two-context comparison mode that shows how summed and pooled MNI figures can pull apart, since MNI does not add up cleanly across contexts the way NISP does.
Pottery Sherd Estimator
The Pottery Sherd Estimator calculates sherd count, sherd weight, and Estimated Vessel Equivalent (EVE) for each ware type in a ceramic assemblage, then compares their percentage shares side by side. It flags cases where count-based and EVE-based proportions diverge significantly, since sherd count is biased toward wares that fragment more finely while EVE gives an unbiased estimate of true vessel proportions.
Artifact Density Calculator Logic
Why Area Density and Volume Density Can't Be Ranked Together
Comparing an area density figure directly against a volume density figure, or ranking densities from units excavated with different screen mesh sizes as though both problems did not exist, is the mistake I see most often. Always confirm the measurement basis, area or volume, and the recovery method behind every density figure before placing it in a comparison table with figures from other units or projects. Class-specific breakdowns often reveal more than a single combined total, so work out separate density figures by artifact class whenever the underlying counts support it, rather than defaulting to one overall number that can mask meaningful compositional differences. This mismatch shows up most often when combining data from a multi-season project, where field crews changed methods, screen mesh size, or recording conventions between seasons without the resulting reports flagging the change clearly, a documentation gap the University of Pittsburgh's density methodology overview touches on when discussing how comparable density figures actually need to be.
What the Artifact Density Calculator Actually Does
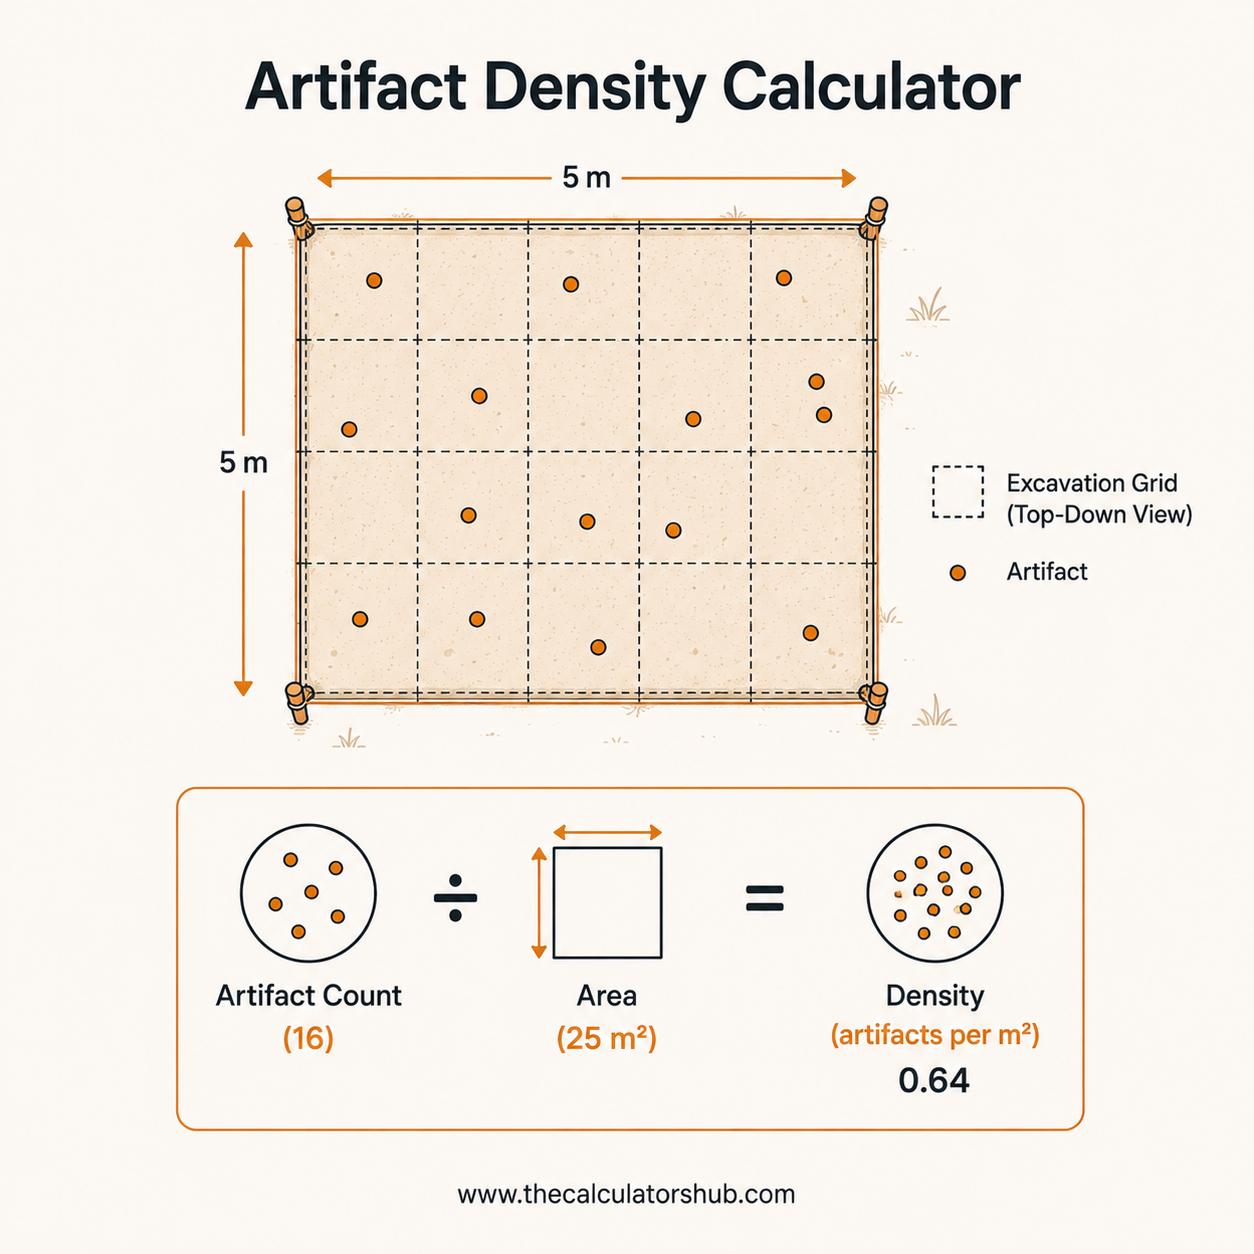
This tool works out how concentrated finds are within an excavation unit or survey area, reporting both area density and volume density from artifact counts and unit dimensions. Archaeologists use density figures to compare activity intensity between units, flag unusually rich or sparse deposits, and support site significance assessments. According to the University of Pittsburgh's overview of artifact density methodology, density is typically expressed either as artifacts per unit area or per unit volume, and the choice depends on how the fieldwork itself was carried out. Figure out which measure a project actually needs before comparing results, since the two are calculated differently and answer different questions about the same deposit, a dense pit feature and a shallow, spread-out scatter can produce very similar area densities while telling completely different stories about how a deposit formed.
Area Density vs Volume Density
Area density, artifacts per square metre, is the natural fit for surface survey or shovel-test data where excavation depth was not consistently controlled. Volume density, artifacts per cubic metre, requires a known excavated depth and is standard for controlled excavation units where the volume of soil removed is actually recorded. Research on volume versus area density methodology in San Diego prehistory studies treats this distinction as a genuine, recurring methodological issue, not a minor technicality.
Measure | Formula | Best Used For |
|---|---|---|
Area density | Total artifacts / excavated area (m2) | Surface survey, shovel tests, uneven depth control |
Volume density | Total artifacts / excavated volume (m3) | Controlled excavation units with known, consistent depth |
A volume density and an area density from the same deposit are not directly comparable without converting one to match the other using a known depth, always confirm this before ranking density figures from different fieldwork methods in the same table or report.
Breaking Down Density by Artifact Class
A single combined density figure can hide meaningful patterns within a deposit. Set out separate counts by material class, ceramics, lithics, faunal bone, rather than only recording a single total, since the relative proportions between classes often carry more interpretive value than raw total density alone. This calculator reports overall density and each class's individual contribution and percentage share, so a shift in the ceramic-to-lithic ratio between units becomes visible immediately rather than buried inside one combined number. Standard excavation methodology guidance, such as the field methods chapter published by the Research Laboratories of Archaeology at UNC, recommends recording artifact classes separately at the point of excavation precisely so this breakdown remains possible during later analysis. A unit dominated by faunal bone relative to its neighbors might point toward a food-processing area, while a lithics-heavy unit nearby could suggest a distinct tool-production zone within the same site.
Using Density to Support Site Interpretation
Density figures feed into more than internal site comparisons. Published research connecting artifact density to population density in settlement pattern studies shows how deposition-rate models can convert a sherd density figure into a rough population estimate for a site's occupation period, given assumptions about discard rates and occupation duration. That conversion sits beyond what this calculator attempts directly, since it depends heavily on region- and period-specific assumptions, but the density figure calculated here is the starting input such models require. Once a working chronology exists for the deposit in question, our Age-Depth Model Calculator can relate a density figure to a specific occupation phase rather than treating an entire unit's depth as a single undifferentiated block of time, and any radiocarbon samples recovered alongside the artifacts can be calibrated with our Radiocarbon Calibration Calculator to anchor that occupation phase to an actual calendar date.
Accuracy and Limitations
The arithmetic here, dividing artifact counts by area or volume, is exact given accurate field measurements. Density figures are only as reliable as the recovery method behind them, a unit excavated with finer screen mesh recovers more small artifacts than one screened more coarsely, inflating its apparent density relative to a unit surveyed with different methods, a recovery bias field excavation manuals such as Idaho State University's specifically instruct students to record and account for. This calculator cannot detect a recovery-method mismatch between units on its own, that check has to come from the fieldwork records themselves. Once recovery method and measurement basis are confirmed consistent, the resulting density figures give a genuinely useful, comparable basis for judging relative concentration across a site.
Frequently Asked Questions
Muhammad Shahbaz Siddiqui
Founder, TheCalculatorsHub
How I used the Artifact Density Calculator to catch a flawed cross-site comparison in a survey report
A heritage consultancy's draft report crossed my desk in 2017, comparing artifact densities across three survey areas ahead of a development impact assessment. The report's headline table listed all three areas side by side with a single "artifact density" column, and one area's figure was more than four times higher than the other two, prompting the client to ask whether that area needed a much larger mitigation budget.
Checking the underlying field data, the apparent difference traced back to a methodology mismatch, not a genuine difference in artifact concentration. Two of the three areas had been surface-walked and recorded as artifacts per square metre, a standard area-density approach for pedestrian survey. The third area had been test-pitted with excavated units recorded as artifacts per cubic metre, a volume-density figure from a completely different measurement basis. Research on volume versus area density methodology in San Diego prehistory studies flags exactly this comparability problem: the two figures are not interchangeable, and combining them in a single ranked table produces a misleading comparison.
Recalculating the test-pitted area's figure as area density, using its known excavation depth to convert consistently with the other two areas, brought all three results into a genuinely comparable range, close enough that no single area stood out as requiring disproportionate additional mitigation budget. The consultancy revised the report to clearly label each area's density by method, area or volume, rather than presenting a single combined column, and added a note explaining why the two measures cannot be directly ranked against each other.