

How It Works
Our engine processes your inputs using verified datasets and logic models to provide real-time results.
Efficiency Tips
Ensure data accuracy for the most reliable interpretation.
Compare results across different scenarios to find the optimal path.
Did you know?
Using standardized tools reduces manual error by up to 95% in complex calculations.
Related Expert Tools
More precision tools in the Archaeology & Artifact Analysis niche.
Artifact Density Calculator
The Artifact Density Calculator works out area density (per square metre) and volume density (per cubic metre) from your excavation unit dimensions and artifact counts. It also breaks results down by artifact class, such as ceramics, lithics, and faunal bone, so compositional differences between units are visible alongside the overall density figure.
Bone Fragmentation Index Calculator
The Bone Fragmentation Index Calculator works out the NISP:MNE ratio per taxon and skeletal element, or a weighted average bone completeness percentage from recorded portion brackets. It includes a built-in caution about the equifinality problem, since carnivore gnawing, trampling, and sediment attrition can all produce a high fragmentation ratio that looks statistically similar to intensive human butchery.
Pottery Sherd Estimator
The Pottery Sherd Estimator calculates sherd count, sherd weight, and Estimated Vessel Equivalent (EVE) for each ware type in a ceramic assemblage, then compares their percentage shares side by side. It flags cases where count-based and EVE-based proportions diverge significantly, since sherd count is biased toward wares that fragment more finely while EVE gives an unbiased estimate of true vessel proportions.
MNI Calculator Logic
Why Two Contexts' MNI Figures Don't Simply Add Up
Adding MNI figures from separate contexts together without checking whether a pooled calculation gives a meaningfully different, usually lower, result is the mistake I run into most often. Always run the comparison before reporting a combined total across multiple excavation seasons or site areas, and lay out both figures if they disagree rather than quietly reporting only the larger one. This happens because left and right side elements counted as separate individuals in two different contexts can spuriously pair up once pooled, since the calculation has no way of knowing those bones came from different times or places. This sensitivity to aggregation is a long-recognized issue in quantitative zooarchaeology, one Donald Grayson worked through at length in his foundational research on the subject, and it's exactly why the comparison mode below lays out the summed and pooled figures side by side instead of picking one silently.
What the MNI Calculator Actually Does
This tool works out the Minimum Number of Individuals represented in a faunal or skeletal assemblage from left and right side element counts. Zooarchaeologists and bioarchaeologists lean on MNI to estimate how many distinct animals or people a collection of bones could stand for, without overstating the count from fragmentary or duplicated remains. According to Wikipedia's overview of the Minimum Number of Individuals method, the method traces back to T. E. White, who set it out in 1953, and it still holds up as a foundational approach across zooarchaeology, bioarchaeology, and forensic anthropology. Sort out element counts by side, left and right, before entering them, since the whole method hinges on that specific breakdown rather than a simple total bone count. A single misidentified side can throw off the final count, so double-checking laterality on ambiguous fragments is worth the extra few minutes.
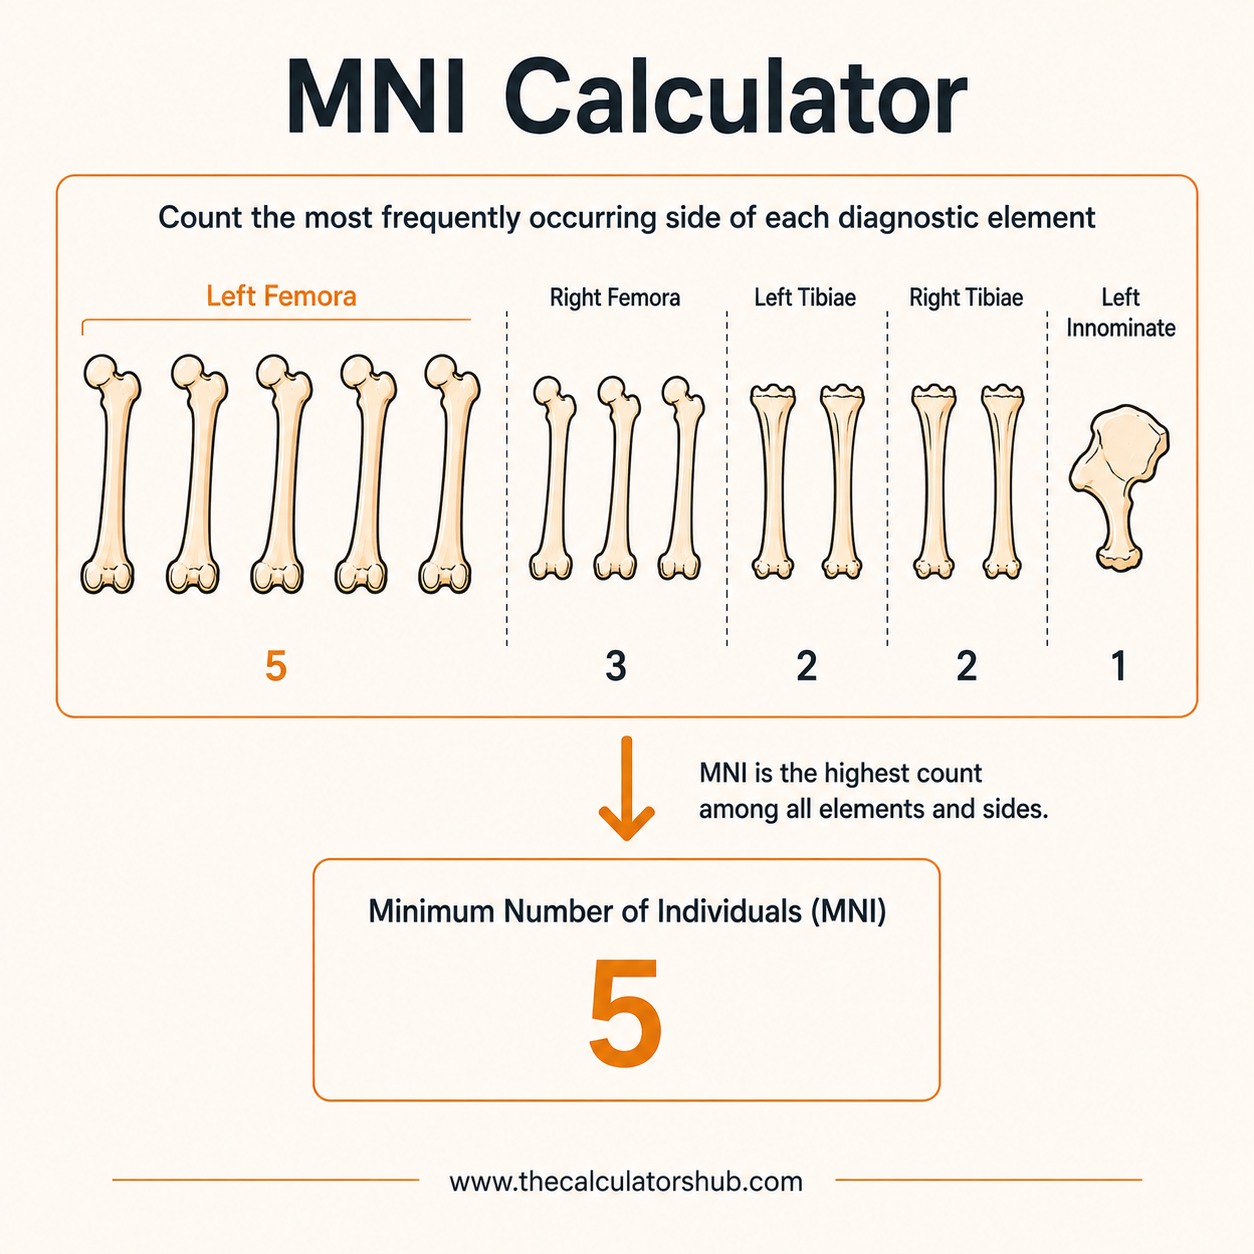
How MNI Is Calculated
For each skeletal element type, femur, mandible, humerus, count left side and right side specimens, then take whichever count is higher as that element's MNI contribution. Two left femurs and one right femur works out to a contribution of 2, not 3, since the single right femur could belong to one of the same two individuals the left femurs already point to.
Element | Left Count | Right Count | MNI Contribution |
|---|---|---|---|
Mandible | 4 | 3 | 4 (higher count) |
Femur | 3 | 5 | 5 (higher count) |
Humerus | 2 | 2 | 2 |
Once every element type has its own contribution worked out, the assemblage's overall MNI is the single highest contribution across all element types, not a sum. In the table above that's 5, set by the femur count, since the assemblage couldn't hold fewer individuals than that. Lay out every element type present before locking in a count rather than stopping at one large number, since a rarer element elsewhere in the collection could end up setting a higher overall MNI than the most abundant one.
MNE and MAU, the Numbers MNI Builds On
MNI rarely stands on its own. It builds on two related figures: MNE (Minimum Number of Elements), which works out the smallest number of a given bone type needed to account for the specimens found, and MAU (Minimal Animal Unit), which scales MNE against how many times that element shows up in a full skeleton. A femur count doesn't need to be scaled against itself, but stacking it up against a rib count does. MNI then layers side-matching, and age-matching where the evidence backs it up, on top of MNE. This matters because MNE is where fragmentation and analyst judgment first come into play, and anything worked out from it, including the MNI figure this tool returns, carries that judgment call forward.
Why MNI Figures Don't Always Match Up Between Sources
MNI often gets presented as one fixed number, but it isn't. At least three counting methods are in active use: the traditional method, the zonation method, and the landmark method. These don't always land on the same figure. This calculator sticks with the traditional left and right, highest-count method, since it's the most widely taught and reported approach. If your MNI figure doesn't match up with another publication, check which method they used before assuming something went wrong.
Method | How It Works | Best Suited For |
|---|---|---|
Traditional (White, 1953) | Highest single-side count per element | Standard reporting, cross-study comparison |
Zonation | Splits elements into landmark zones before counting | Highly fragmented assemblages |
Landmark | Counts non-repeating anatomical landmarks | Detailed fragmentation and preservation analysis |
MNI vs NISP: Why the Two Numbers Rarely Match
NISP, the Number of Identified Specimens, is a raw count of every identifiable bone fragment, almost always far larger than MNI. Wikipedia's entry on NISP illustrates this: an assemblage with 100 identified human femurs and 60 horse hooves works out to an MNI of at least 50 humans and 15 horses, a fraction of the raw specimen count. NISP is simpler to work out and fully additive, since specimen counts from different contexts add up cleanly to a site total, a property MNI doesn't share, which is the source of the aggregation issue above. Work out both figures side by side wherever possible, since the ratio between them says something real about fragmentation and preservation, not just headcount. Once an assemblage's MNI is settled, our Artifact Density Calculator relates that individual count back to the unit or area it came from, and the Age-Depth Model Calculator ties it to a specific stratigraphic phase across multiple occupation levels. According to Wikipedia's broader overview of zooarchaeology, NISP and MNI are generally reported together rather than one replacing the other, worth keeping in mind so a gap between the two figures reads as expected behaviour rather than an error.
Age and Side-Matching
Comparing left and right counts is only the starting point. A full MNI count also takes completeness, body size, and age into account wherever the data allows it. Two right femurs that clearly belong to different age groups, one juvenile and one adult, count as two individuals even without a matching left side, the same way two left femurs would. Leaving age-matching out when the evidence is there tends to undercount individuals, since it lumps together bones that side-matching alone would have kept apart.
Commingled and Associated Specimens
A related judgment call comes up with associated elements found close together. If a skull's cranium and both dentaries get logged as three separate specimens because they were catalogued individually, should they count as three toward NISP but still resolve to one individual for MNI? Most practitioners say yes: count them separately for NISP, but let the anatomical connection override the raw specimen count when working out MNI, though this standard loosens the further apart the pieces were actually recovered. It's the same underlying issue as the multi-context aggregation problem above, just playing out within a single context instead of across two.
Accuracy and Limitations
The counting logic here, the higher of left and right counts per element and the highest contribution across elements, holds up exactly given accurate input data. Neither NISP nor MNI counts as a true population figure. Both are only ordinal-scale measurements, ranking relative abundance rather than pinning down an exact number, and heavily fragmented assemblages generally carry more identification uncertainty than the MNI figure alone conveys. Not every zooarchaeologist reaches for MNI by default either; the Illinois State Museum's zooarchaeology reference notes many researchers actually prefer NISP for being easier and more objective to work out, since deciding which fragments count as "the same" side of an element, especially for irregular or paired anatomy like fish, still comes down to analyst judgment.
Frequently Asked Questions

Muhammad Shahbaz Siddiqui
Founder, TheCalculatorsHub
How I used the MNI Calculator to catch an inflated individual count from pooling two excavation seasons
During a field season in 2011, a zooarchaeology student asked me to check her faunal report ahead of submission, specifically a claim that a cattle assemblage represented at least 11 individuals across two excavation seasons at the same midden feature. She had reached that figure by calculating MNI separately for each season's mandibles and long bones, then adding the two seasons' totals together, which felt like the natural way to combine two years of fieldwork into one final count.
Running the same raw left and right element counts through a pooled calculation, combining both seasons' counts before taking the maximum per element rather than after, gave a noticeably lower figure. The gap traced back to a well-documented property of the MNI method: it is not simply additive across separate aggregation units the way a raw specimen count is. Left- and right-side elements from genuinely different seasons can pair up once pooled in a way that was not possible when each season was counted in isolation, and summing two separately calculated MNI figures assumes a worst case that pooling does not necessarily support.
The student recalculated using the pooled figure as her primary reported number, presenting both the summed and pooled results side by side in her methods section rather than quietly picking whichever number was larger. Her supervisor's feedback specifically praised the transparency of showing both figures, since it let a reader judge for themselves how sensitive the final count was to the aggregation choice rather than presenting one number as though it were the only defensible answer.