

How It Works
Our engine processes your inputs using verified datasets and logic models to provide real-time results.
Efficiency Tips
Ensure data accuracy for the most reliable interpretation.
Compare results across different scenarios to find the optimal path.
Did you know?
Using standardized tools reduces manual error by up to 95% in complex calculations.
Related Expert Tools
More precision tools in the same niche.
Artifact Density Calculator
The Artifact Density Calculator works out area density (per square metre) and volume density (per cubic metre) from your excavation unit dimensions and artifact counts. It also breaks results down by artifact class, such as ceramics, lithics, and faunal bone, so compositional differences between units are visible alongside the overall density figure.
Bone Fragmentation Index Calculator
The Bone Fragmentation Index Calculator works out the NISP:MNE ratio per taxon and skeletal element, or a weighted average bone completeness percentage from recorded portion brackets. It includes a built-in caution about the equifinality problem, since carnivore gnawing, trampling, and sediment attrition can all produce a high fragmentation ratio that looks statistically similar to intensive human butchery.
MNI Calculator
The MNI Calculator works out the Minimum Number of Individuals in a skeletal assemblage by comparing left and right element counts and taking the highest one. It also checks MNI against NISP, explains how MNI ties back to MNE and MAU, and includes a two-context comparison mode that shows how summed and pooled MNI figures can pull apart, since MNI does not add up cleanly across contexts the way NISP does.
Settlement Population Estimator Logic
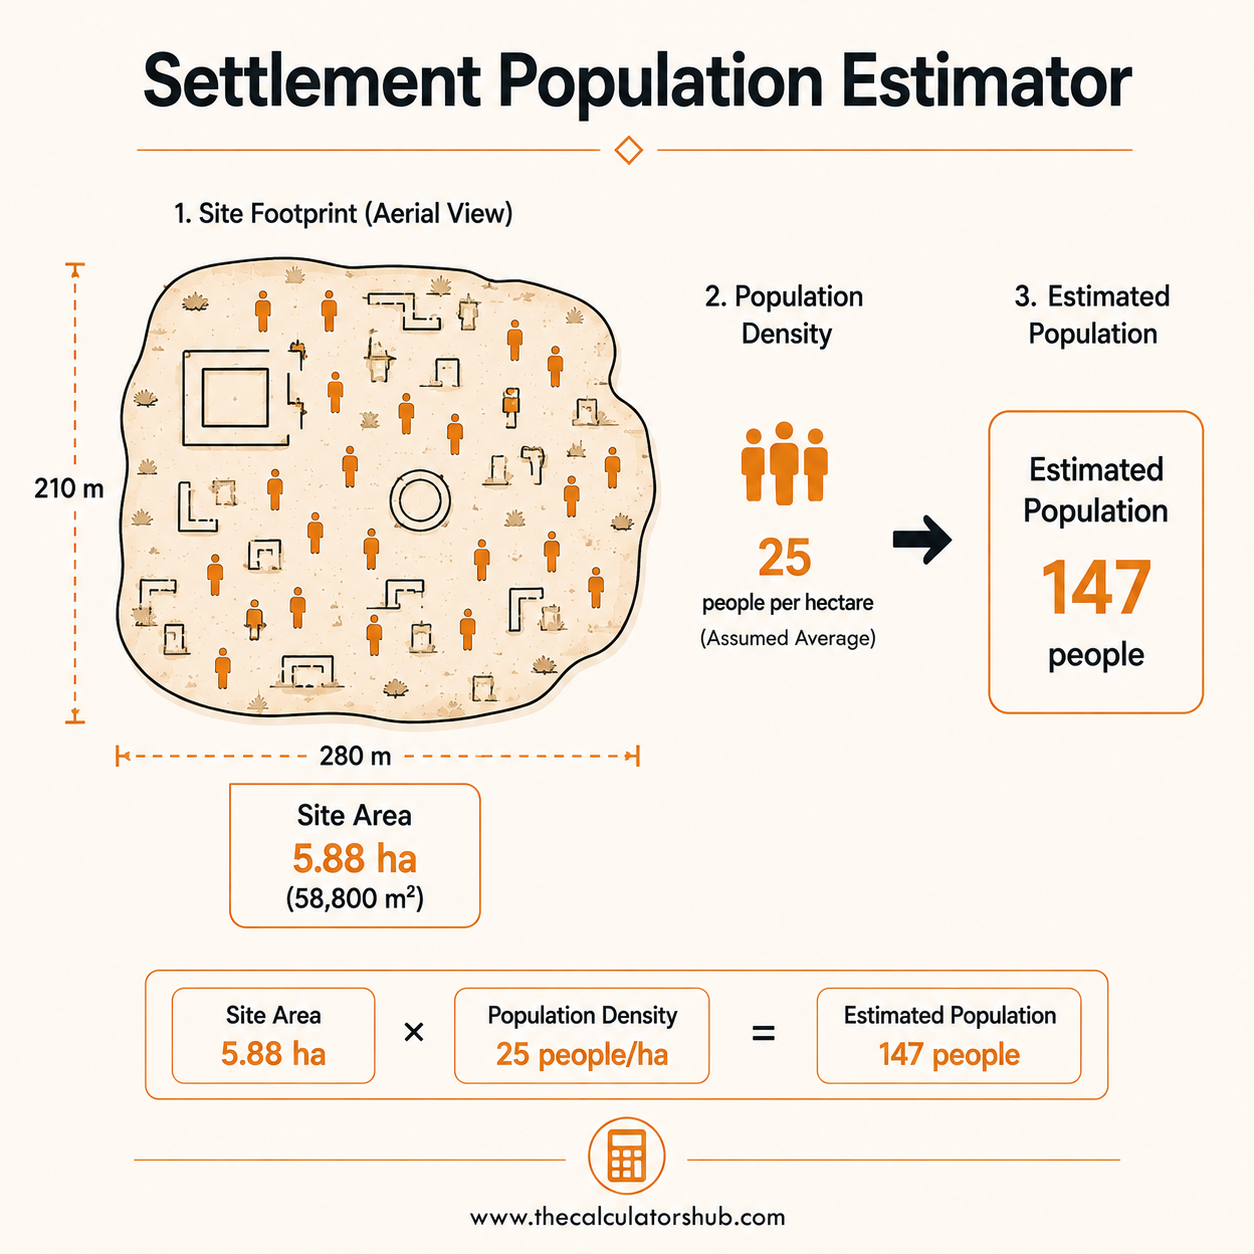 Why One Coefficient Can Swing an Estimate by 67%
The mistake I see most often is reporting a single population figure as though it were a precise measurement, when in practice it depends entirely on which coefficient or household size assumption was applied. Always state the specific coefficient or household size figure behind any population estimate you report, and consider presenting a range rather than a single number whenever more than one defensible coefficient exists. Treat close agreement between an area-based and a household-based estimate as a meaningful check worth seeking out, since two independent methods converging on a similar figure is considerably more persuasive than either method reported alone, in line with how the original Naroll-Brown restudy literature itself was built by testing one formula's assumptions against an expanded independent dataset.
What the Settlement Population Estimator Actually Does
This tool works out an approximate population for an archaeological site using either a floor area coefficient or a house count multiplied by average household size. Archaeologists use these estimates to compare settlement sizes across a region, model demographic change over time, and support site significance assessments. According to Yale's eHRAF cross-cultural hypothesis archive, Raoul Naroll's 1962 cross-cultural study of dwelling floor area first proposed that population size could be predicted directly from built floor area, becoming one of the most widely cited formulas in settlement archaeology. Neither method produces an exact headcount; both are working estimates built on ethnographic analogy.
Floor Area Coefficients: Naroll's Constant and Its Restudy
Coefficient | Source | Population from 850 m² Floor Area |
|---|---|---|
10 m² per person | Naroll (1962) | 85 people |
6 m² per person | Brown (1987 restudy) | 142 people |
Naroll's original 1962 formula set the coefficient at 10 square metres of floor area per person, based on ethnographic data from 18 societies. Barton McCaul Brown's 1987 restudy, published in American Antiquity, revisited the relationship with a larger dataset and proposed a considerably lower working coefficient of 6 square metres per person. That is a 67% difference in the population estimate for the exact same floor area, driven entirely by which published coefficient was applied.
House Count and Household Size: An Alternative Approach
Where contemporaneous structures or hearths can be reliably counted, multiplying that count by an average household size offers a different route to the same estimate. Look into regional ethnographic or ethnohistoric analogy to set a defensible household size figure rather than defaulting to a round number, since average household size varies considerably across cultures, periods, and settlement types. Published work connecting artifact density to population density uses multiple independent proxies for the same reason, since no single measure of past population size is reliable enough to stand entirely on its own. Once you have a working estimate, our Artifact Density Calculator can help relate artifact recovery rates back to it.
Why No Single Coefficient Is Universally Correct
The ethnographic samples both Naroll and Brown worked from cover a wide range of societies with genuinely different housing customs, climates, and household structures. Brown's own restudy findings point to settlement size and density, rather than climate or contact history, as the factor that best explains why the floor-area-to-population relationship varies so much between samples. Some researchers propose settlement-specific or region-specific adjustments rather than a single universal figure, since a fixed coefficient does not transfer well across every kind of site.
Accuracy and Limitations
The arithmetic here, dividing area by a coefficient or multiplying house count by household size, is exact given accurate inputs. Both methods rest on ethnographic analogy rather than direct measurement, and neither this calculator nor the underlying published coefficients can verify whether a specific site's culture matches the assumptions built into either sample. Floor area figures also depend on accurately distinguishing genuinely contemporaneous structures from those built and abandoned at different times, a judgment call this calculator cannot make on your behalf. Report a range rather than a single figure wherever your site's occupation history is not fully resolved.
Frequently Asked Questions

Muhammad Shahbaz Siddiqui
Founder, TheCalculatorsHub
How I used the Settlement Population Estimator to explain a 67% gap between two published population figures for the same site
A colleague drafting a heritage interpretation panel for a museum exhibit, back in 2020, stated a Late Neolithic settlement's population as "approximately 85 people," based on a total roofed floor area of 850 square metres run through the classic Naroll's Constant of 10 square metres per person. A visiting researcher familiar with more recent literature flagged the figure as likely a significant underestimate, but without a clear explanation the museum was reluctant to change a number already approved for the panel text.
Running the same 850 square metre figure through the alternative coefficient from Brown's 1987 restudy of Naroll's constant, published in American Antiquity, gave a population estimate of roughly 142 people using its 6 square metre per person coefficient, a 67% increase over the original figure purely from the choice of coefficient. Brown's restudy had found the original Naroll figure, based on his 1962 cross-cultural sample, did not hold consistently once a broader dataset was examined, and proposed the lower coefficient as a better general fit.
The museum's curatorial team decided not to simply swap one number for another, since neither coefficient was demonstrably correct for this specific region and period without further contextual evidence. Instead, the final panel text was revised to state a range, "roughly 85 to 140 people, depending on the population coefficient applied," with a footnote explaining that published coefficients for estimating population from floor area vary meaningfully in the archaeological literature. Visitor feedback specifically noted appreciation for the transparency about scientific uncertainty rather than a single falsely precise number.