

How It Works
Our engine processes your inputs using verified datasets and logic models to provide real-time results.
Efficiency Tips
Ensure data accuracy for the most reliable interpretation.
Compare results across different scenarios to find the optimal path.
Did you know?
Using standardized tools reduces manual error by up to 95% in complex calculations.
Related Expert Tools
More precision tools in the same niche.
Dendrochronology Alignment Calculator
The Dendrochronology Alignment Calculator works out the Gleichlaufigkeit (percentage of parallel variation) and Baillie-Pilcher t-value between two standardized ring-width index series at a candidate overlap position. Its best-fit offset search mode slides a floating sample across a longer master chronology and ranks every tested position by statistical strength, flagging an ambiguous match when two offsets score closely together.
Obsidian Hydration Dating Calculator
The Obsidian Hydration Dating Calculator converts a measured hydration rim thickness and a source-specific rate constant into an estimated age using the standard quadratic diffusion relationship. Its calibration mode works the same relationship in reverse, deriving a local rate constant from a rim measured on obsidian associated with an independently dated context, the real method used to establish rate constants for a given obsidian source.
Soil Layer Depth Calculator
The Soil Layer Depth Calculator converts a field depth-below-datum (DBD) reading into an absolute site elevation, accounting for a separate unit datum offset where used. It also calculates a stratum's average thickness, thickness range, and estimated volume from top and bottom DBD readings taken at multiple points across an excavation unit's floor, flagging strata that slope noticeably from corner to corner.
Pollen Count Percentage Calculator Logic
Why Two Pollen Percentages Aren't Always Comparable
The mistake I see most often is comparing raw percentages between samples that used different pollen sum definitions, one excluding aquatics and sedges and another including everything, without noticing the sums are not actually the same kind of denominator. Always confirm exactly which taxa a published pollen sum excludes before treating its percentages as directly comparable to your own data. In practice, misidentification is a related and genuinely underappreciated risk: a documented case from an ancient Tehran burial shows a joint-pine (Ephedra) pollen grain mistaken for a pinworm egg in a published paleoparasitology study, a reminder that careful morphological identification matters as much as the arithmetic once counts are in hand.
What the Pollen Count Percentage Calculator Actually Does
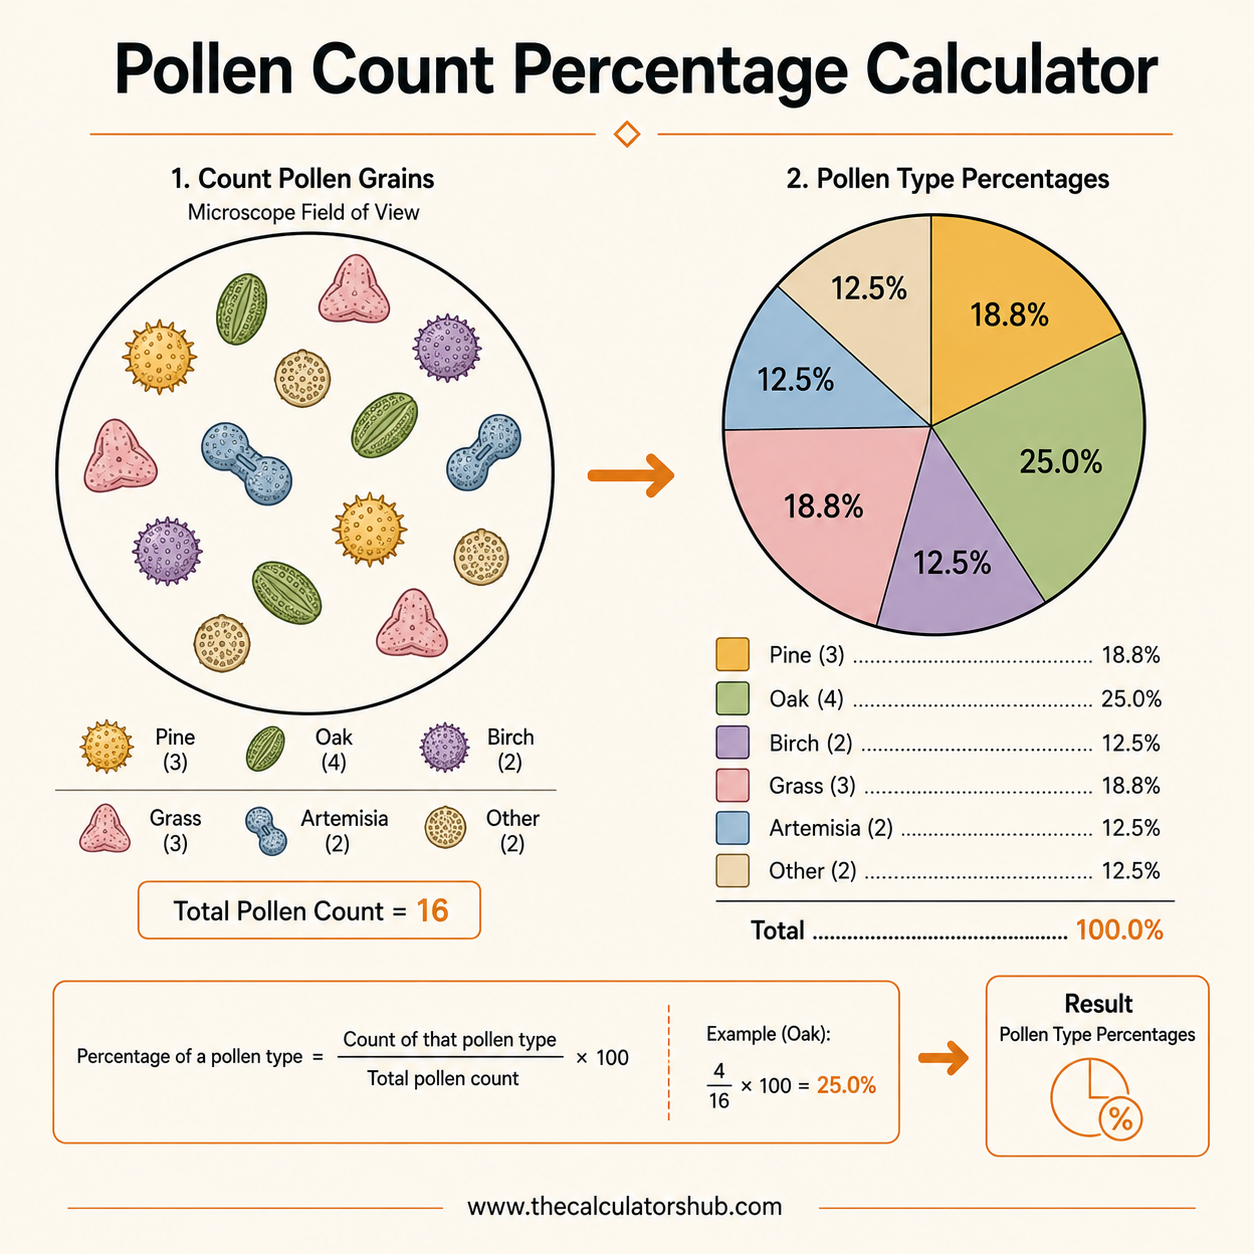
This tool works out each taxon's share of a sample's pollen sum, the arboreal-to-non-arboreal (AP:NAP) ratio, and a 95% confidence interval for a reported percentage given the total count size. Archaeobotanists and palynologists use these figures to reconstruct past vegetation, detect forest clearance, and gauge how reliable a given percentage actually is before building an interpretation on it. According to the Maryland Archeobotany guide to reading a pollen diagram, percentages are conventionally calculated against a pollen sum that excludes sedges (Cyperaceae), strictly aquatic taxa, and spores, rather than every grain identified in a sample.
Calculating Percentages from the Pollen Sum
Taxon | Count | Group | % of Pollen Sum |
|---|---|---|---|
Quercus (oak) | 82 | Arboreal | 34.2% |
Pinus (pine) | 34 | Arboreal | 14.2% |
Poaceae (grasses) | 96 | Non-arboreal | 40.0% |
Cyperaceae (sedges) | 15 | Excluded | 6.3% of sum |
The pollen sum is the denominator every percentage in a standard diagram is calculated against, deliberately excluding local, over-represented taxa such as sedges and open-water aquatics so they cannot distort the terrestrial vegetation signal. Each remaining taxon's percentage is its count divided by the pollen sum, multiplied by 100. This convention has a long history in archaeological applications, established in early work discussed in the British Agricultural History Society's review of pollen analysis for early agrarian history.
The AP:NAP Ratio and What It Reveals About Land Use
The arboreal pollen to non-arboreal pollen ratio compares total tree pollen against total herb, grass, and shrub pollen within the pollen sum, giving a broad-strokes read on how wooded or open a landscape was, as the Oxford Reference entry on the AP:NAP ratio describes. A falling AP:NAP ratio through a stratigraphic sequence is one of the classic signals archaeologists look into when tracking prehistoric forest clearance. That said, work out the trend across an entire sequence rather than reading a single sample in isolation, since a short-term natural clearance event can produce a temporary dip that looks similar to sustained anthropogenic clearance.
How Reliable Is a Pollen Percentage? Confidence Intervals and Minimum Counts
A percentage calculated from a small pollen sum carries far more statistical uncertainty than the same percentage from a large one, formalised by Maher's (1972) nomograms for computing 95% confidence limits of pollen data. Most palynologists treat roughly 300 grains as the practical minimum pollen sum for reasonably stable percentages. The standard normal approximation gives a quick estimate: standard error equals the square root of p(1-p)/n, and the 95% interval is roughly the percentage plus or minus 1.96 times that standard error. Where a pollen core also needs an absolute chronology, our Radiocarbon Calibration Calculator handles the dating side of the same sequence.
Accuracy and Limitations
The percentage and AP:NAP arithmetic here is exact given accurate taxon counts and a consistently applied pollen sum definition. The confidence interval mode uses the standard normal approximation rather than the exact Mosimann equations behind Maher's original nomograms, which remains reasonable in most cases but becomes less accurate for percentages very close to 0% or 100% or for unusually small counts. This calculator also cannot correct for differential pollen production between taxa; a wind-pollinated tree like pine famously over-produces pollen relative to its actual abundance, a bias a regression-based approach to estimating plant abundance addresses directly but a raw percentage does not.
Frequently Asked Questions

Muhammad Shahbaz Siddiqui
Founder, TheCalculatorsHub
How I used the Pollen Count Percentage Calculator to catch a mismatched pollen sum before a site comparison went to print
A graduate student preparing a comparative chapter on prehistoric land clearance, back in 2022, ran into a puzzling result: two nearby sedimentary cores, published a decade apart by different research teams, showed noticeably different oak (Quercus) percentages for what should have been roughly the same period, one core reporting oak at 34% and the other at just 22% for overlapping radiocarbon-dated layers. The draft chapter was about to present this as evidence of genuinely patchy woodland cover between the two locations.
Working back through both papers' methods sections turned up the real explanation before the claim went further: one study's pollen sum excluded Cyperaceae (sedges) and aquatic taxa in line with the standard convention, while the older study's sum had included them, quietly inflating its denominator and depressing every terrestrial taxon's reported percentage as a result. Recalculating the older study's raw counts against a sum built the same way as the newer one brought its oak figure up to 33%, just one point off the newer core rather than 12 points off.
The chapter was rewritten to flag pollen sum methodology explicitly whenever comparing percentages across studies, and to recalculate from raw counts wherever the original data allowed it rather than trusting published percentages at face value. The student's supervisor specifically noted that catching this before submission avoided building an entire regional land-use argument on what would have been a purely methodological artifact rather than a real ecological difference.